Building a custom malware sandbox with PANDA - Part 1
Dynamic analysis is a fundamental technique in computer security and ubiquotous in the context of malware analysis. The idea is to execute the samples in a controlled environment and then monitor this environment in order to understand the malware's behaviour. This is attractive because it enables us to make precise and concrete analysis based on actual executions. We use our observations for a variety of purposes, such as determining if a given sample is malicious or not, identifying communication channels, generic unpacking and much more. There exists a variety of systems for this, both open-source systems like Cuckoo Sandbox, CAPE sandbox, Spengler and Drakvuf, and also commercial solutions like LastLine, VMRay and many more.
In the last decade there has been many improvements in fine-grained analysis techniques that focus on automating reverse engineering. The PANDA reverse engineering framework is particularly interesting as it is a mature framework that offers the foundation needed to develop fine-grained dynamic analysis tools, which has a large number of applications such as malware analysis, vulnerability discovery and root-cause analysis. In this blog post series we will introduce the reader how to get started with the PANDA reverse engineering framework by creating a custom malware sandbox from scratch.
The goal of this blog post is to show how to perform analysis of a given Windows application using the PANDA framework. More specifically, in this post we will cover:
- - An overview of PANDA from a plugin-writers perspective
- - How to setup an infrastructure for recording and replaying Windows systems (without owning a Windows CD-key)
- - How to create an infrastructure that allows easy record/replay of applications that exist outside the analysis system
- - How to use existing PANDA plugins to analyse the guest system
You can find the scripts used in this blog post on Github
Overview of PANDA
PANDA is an acronym for Platform for Architecture-Neutral Dynamic Analysis and is mainly built out of NYU, MIT Lincoln lab and Northeastern University. The project is actively maintained on Github here and comes with an extensive manual located here. In comparison to many other dynamic analysis systems, a distinguishing feature of PANDA is that the analysis is performed outside-the-box. Specifically, this means that PANDA executes a guest virtual machine and all analysis is based on interpreting the state of the guest from the virtual hardware.
Architecture and features of PANDA
PANDA is engineered around the QEMU full-system emulator and currently synced with QEMU version 2.9.1. The central aspect of PANDA is a system that allows recording and replaying of a whole OS execution as a way of performing rapid reverse engineering. The framework is user-friendly in that it has an extensive plugin architecture and comes with many existing plugins (as of this writing, there are more than 40 plugins in the PANDA repository). In addition to this, PANDA also comes with a feature for translating QEMU's intermediate representation, TCG, into LLVM code which makes it possible to write full-system dynamic analysis tools by way of LLVM passes. This is a powerful feature that bridges two program analysis frameworks together, QEMU and LLVM, in order to exploit synergies between the two.

In this blog post our emphasis is on using PANDA by writing plugins rather than extending the core of PANDA. In the figure below we show the core components that make it possible to write PANDA plugins. From a high level perspective, plugins interact with QEMU in two main ways: (1) through instrumentation callbacks and (2) through an inspection API that exposes the state of the guest system, e.g. the state of the memory. Together, we call these two the plugin interface.
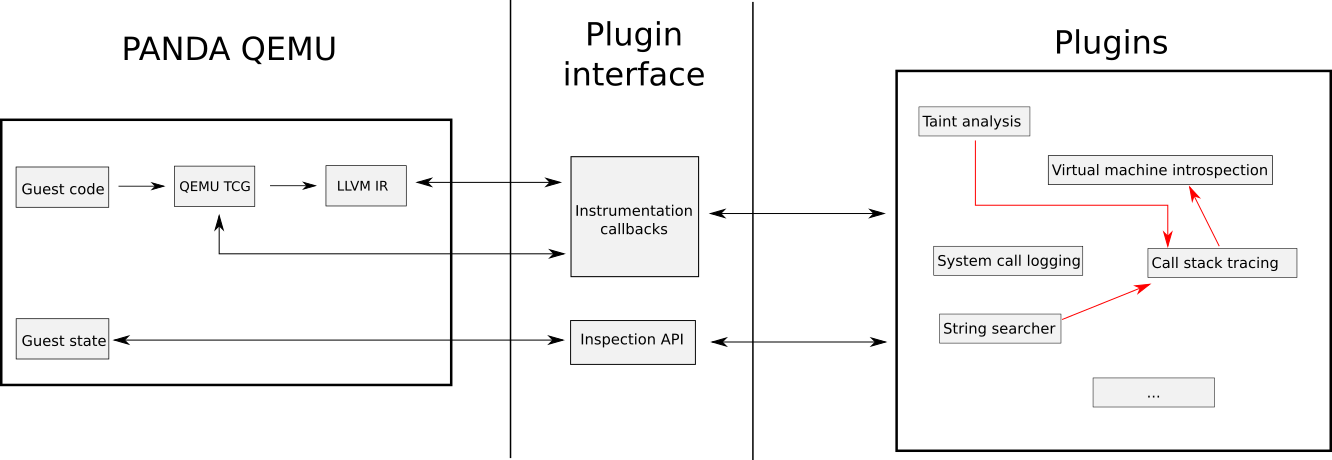
Plugins use the plugin interface rigorously to create complex dynamic analysis tools. The full list of instrumentation callbacks is listed in the official PANDA manual here with some of the most important ones being:
| Callback name | Trigger point |
|---|---|
| PANDA_CB_BEFORE_BLOCK_EXEC | Before execution of each basic block |
| PANDA_CB_AFTER_BLOCK_EXEC | After execution of each basic block |
| PANDA_CB_INSN_EXEC | Before an instruction is executed |
| PANDA_CB_AFTER_INSN_EXEC | After an instruction is executed |
| PANDA_CB_VIRT_MEM_AFTER_READ | After a read of virtual memory |
| PANDA_CB_VIRT_MEM_AFTER_WRITE | After a write to virtual memory |
| PANDA_CB_HD_READ | Each HDD read |
| PANDA_CB_HD_WRITE | Each HDD write |
| PANDA_CB_ASID_CHANGED | After an ASID (address space identifier - aka PGD) write |
In essence, these callbacks allow us to hook the execution whenever a special event occurs, such as before the execution of each guest instruction, and have our own C/C++ code execute. Furthermore, PANDA encourages plugin-writers to reuse functionality from each other and compose sophisticated analyses by way of using each plugin as an "atomic entity". As such, PANDA supports various features that makes it possible for plugins to depend on other plugins and also import/export functionality.
We use the callbacks to hook execution of the guest machine and execute our analysis code, and PANDA then provides several features that makes it easy to interpret the guest state. In particular, the following functions from common.h provides roughly the API we are offered - by the core of PANDA - to analyse the state of the guest system:
| Function name | Description |
|---|---|
| panda_physical_memory_rw | Reads or writes to physical memory |
| panda_virt_to_phys | Converts a virtual address to a physical address |
| panda_virtual_memory_read | Reads virtual memory |
| panda_virtual_memory_write | Writes to virtual memory |
| panda_in_kernel | Determines whether execution currently occurs within the kernel |
| panda_current_sp | Returns the current value of the stack pointer |
In addition to this, PANDA's callbacks provide easy access to the QEMU struct CPUState which gives us access to guest machine-specific features, e.g. the registers. As such, since our analysis is performed outside the guest system we must perform analysis with a "bottom-up" approach by interpreting the binary data and creating abstractions upwards towards OS-level constructs. This process is called virtual machine introspection (VMI) and PANDA conveniently provides a lot of plugins that can do this for us for a variety of operating systems.
The collection of plugins that come with PANDA is one of the major strengths behind the project, and in many ways quite fascinating. It's such a strong asset of PANDA because it makes it easy to rapidly develop analysis tools that leverage complex analysis techniques such as dynamic taint analysis. A list of the plugins in PANDA is given through the manual here and you can see the source code within the folder tree here. The following table shows some of the interesting ones:
| Plugin name | Description |
|---|---|
| syscalls2 | Provides callbacks that allow notification whenever system calls occur in the guest, and can provide the parameters for each system call |
| callstack_instr | Keeps track of function calls and returns of the guest. |
| coverage | List the address and size of every block executed, along with the process ID and thread ID at the time the block was executed. |
| stringsearch | Searches for strings being read or written to memory at different tap points. |
| taint2 | Full-system dynamic taint analysis. |
| tainted_net | Allows the user to taint incoming network packets and quest on outgoing network packets. |
| ida_taint2 | Extracts information about which instructions operated on tainted data that can be visualised in IDA. |
| win7x86intro | Virtual machine introspection for Windows 7 32-bit. |
| winxp86intro | Virtual machine introspection for Windows XP 32-bit. |
| osi_linux | Virtual machine introspection for Linux. |
Building PANDA
In order to begin working with PANDA the first step is to compile the source code. PANDA comes with a straightforward build system for Ubuntu and for this blog post I have used a clean install of Ubuntu 16.04 within a VirtualBox machine.
$ git clone https://github.com/panda-re/panda
Cloning into 'panda'...
remote: Enumerating objects: 62, done.
remote: Counting objects: 100% (62/62), done.
remote: Compressing objects: 100% (59/59), done.
remote: Total 356047 (delta 29), reused 20 (delta 3), pack-reused 355985
Receiving objects: 100% (356047/356047), 191.65 MiB | 6.52 MiB/s, done.
Resolving deltas: 100% (283761/283761), done.
Checking connectivity... done.

$ ./panda/panda/scripts/install_ubuntu.sh
...
...
[panda_install] PANDA is built and ready to use in panda/build/[arch]-softmmu/qemu-system-[arch].
$
Enabling analysis of Windows applications in PANDA
Recording and Replaying a developer Windows image
In this blogpost, the goal is to enable analysis of arbitrary Windows applications and the first step in reaching our goal is to enable recording and replaying of Windows executions. To do this we need a Windows image and we will get that from the official Microsoft webpage where they offer developer-images to test your applications. We will use one of these images, in this case a Windows 7 image, and convert them into a convenient format from VirtualBox-friendly to QEMU-friendly. The script below will download an image and convert it to a QCOW2 format that can be used by PANDA.
Running this script we get a qcow2 image ready for execution with PANDA in IE8-win7-disk1.qcow. In order to test if PANDA is able to execute our image run the command $panda/build/i386-softmmu/qemu-system-i386 IE8-win7-disk1.qcow2 which should launch the Windows machine. Assuming this works, the next step is to ensure that we can record and replay an execution. The simple steps to do this is launching our virtual machine in a similar fashion and then use the PANDA commands begin_record NAME and end_record where NAME is simply some arbitrary name that you give the recording.
The process of recording an execution in PANDA is shown in the below output.
$ ./panda/build/i386-softmmu/qemu-system-i386 -monitor stdio -show-cursor -m 8192 ./IE8_win7_disk1.qcow2
QEMU 2.8.50 monitor - type 'help' for more information
(qemu) main-loop: WARNING: I/O thread spun for 1000 iterations

(qemu) begin_record sample
(qemu) writing snapshot:        ./sample-rr-snp
opening nondet log for write :  ./sample-rr-nondet.log

(qemu) end_record
(qemu) Time taken was: 17 seconds.
Checksum of guest memory: 0x13bbbcdb

$ ls -la
total 24767408
drwxrwx--- 1 root vboxsf        4096 Jul 16 10:23 .
drwxrwx--- 1 root vboxsf        4096 Jul 16 10:02 ..
-rwxrwx--- 1 root vboxsf 11149049856 Jul 16 10:23 IE8_win7_disk1.qcow2
-rwxrwx--- 1 root vboxsf  4573000704 Sep 23  2015 IE8 - Win7-disk1.vmdk
-rwxrwx--- 1 root vboxsf  4573019136 Sep 23  2015 IE8 - Win7.ova
-rwxrwx--- 1 root vboxsf       17138 Sep 23  2015 IE8 - Win7.ovf
-rwxrwx--- 1 root vboxsf  4497629147 Sep 23  2015 IE8.Win7.VirtualBox.zip
-rwxrwx--- 1 root vboxsf     1989146 Jul 16 10:23 sample-rr-nondet.log
-rwxrwx--- 1 root vboxsf   567470712 Jul 16 10:23 sample-rr-snp
The files that PANDA has created which we need for replaying the execution is given in sample-rr-nondet.log and sample-rr-snp. The sample-rr-snp file contains the memory snapshot at the start of the recording and the sample-rr-nondet.log file contains the input to the CPU that is required to replay the execution.
Finally, to replay the execution we use the command-line parameter -replay NAME accepted by PANDA's qemu. The process of replaying the execution we just recorded is shown in the below output.
$ ./panda/build/i386-softmmu/qemu-system-i386 -monitor stdio -show-cursor -m 8192 -replay sample
QEMU 2.8.50 monitor - type 'help' for more information
(qemu) loading snapshot
... done.
opening nondet log for read :   ./sample-rr-nondet.log
./sample-rr-nondet.log:  2420013644 instrs total.
sample:    24200159 (  1.00%) instrs.    0.94 sec.  1.55 GB ram.
sample:    48400287 (  2.00%) instrs.    1.32 sec.  1.56 GB ram.
sample:    72600415 (  3.00%) instrs.    1.57 sec.  1.57 GB ram.
sample:    96800548 (  4.00%) instrs.    1.86 sec.  1.57 GB ram.
sample:   121000684 (  5.00%) instrs.    2.20 sec.  1.58 GB ram.
sample:   145200825 (  6.00%) instrs.    2.45 sec.  1.58 GB ram.
sample:   169400959 (  7.00%) instrs.    2.86 sec.  1.59 GB ram.
sample:   193601097 (  8.00%) instrs.    3.13 sec.  1.59 GB ram.
sample:   217801234 (  9.00%) instrs.    3.43 sec.  1.60 GB ram.
sample:   242001368 ( 10.00%) instrs.    3.70 sec.  1.60 GB ram.
sample:   266201509 ( 11.00%) instrs.    4.04 sec.  1.60 GB ram.
sample:   290401644 ( 12.00%) instrs.    4.37 sec.  1.60 GB ram.
sample:   314601792 ( 13.00%) instrs.    4.76 sec.  1.61 GB ram.
sample:   338801916 ( 14.00%) instrs.    5.11 sec.  1.61 GB ram.
sample:   363002047 ( 15.00%) instrs.    5.44 sec.  1.61 GB ram.
sample:   387202184 ( 16.00%) instrs.    5.85 sec.  1.62 GB ram.
sample:   411402321 ( 17.00%) instrs.    6.36 sec.  1.64 GB ram.
sample:   435602458 ( 18.00%) instrs.    6.76 sec.  1.65 GB ram.
sample:   459802597 ( 19.00%) instrs.    7.13 sec.  1.65 GB ram.
sample:   484002729 ( 20.00%) instrs.    7.49 sec.  1.65 GB ram.
sample:   508202874 ( 21.00%) instrs.    8.04 sec.  1.66 GB ram.
sample:   532403004 ( 22.00%) instrs.    8.49 sec.  1.67 GB ram.
sample:   556603162 ( 23.00%) instrs.    8.80 sec.  1.67 GB ram.
sample:   580803278 ( 24.00%) instrs.    9.20 sec.  1.67 GB ram.
sample:   605003437 ( 25.00%) instrs.    9.61 sec.  1.68 GB ram.
sample:   629203557 ( 26.00%) instrs.    9.99 sec.  1.68 GB ram.
sample:   653403687 ( 27.00%) instrs.   10.34 sec.  1.68 GB ram.
sample:   677603838 ( 28.00%) instrs.   10.71 sec.  1.68 GB ram.
sample:   701803983 ( 29.00%) instrs.   11.07 sec.  1.68 GB ram.
sample:   726004095 ( 30.00%) instrs.   11.59 sec.  1.69 GB ram.
sample:   750204256 ( 31.00%) instrs.   12.00 sec.  1.69 GB ram.
sample:   774404373 ( 32.00%) instrs.   12.42 sec.  1.70 GB ram.
sample:   798604517 ( 33.00%) instrs.   12.89 sec.  1.70 GB ram.
sample:   822804653 ( 34.00%) instrs.   13.32 sec.  1.71 GB ram.
sample:   847004777 ( 35.00%) instrs.   13.64 sec.  1.71 GB ram.
sample:   871204927 ( 36.00%) instrs.   13.99 sec.  1.72 GB ram.
sample:   895405049 ( 37.00%) instrs.   14.23 sec.  1.72 GB ram.
sample:   919605204 ( 38.00%) instrs.   14.50 sec.  1.72 GB ram.
sample:   943805323 ( 39.00%) instrs.   14.86 sec.  1.72 GB ram.
sample:   968005462 ( 40.00%) instrs.   15.18 sec.  1.72 GB ram.
sample:   992205600 ( 41.00%) instrs.   15.65 sec.  1.72 GB ram.
sample:  1016405732 ( 42.00%) instrs.   16.02 sec.  1.72 GB ram.
sample:  1040605868 ( 43.00%) instrs.   16.43 sec.  1.73 GB ram.
sample:  1064806008 ( 44.00%) instrs.   16.92 sec.  1.74 GB ram.
sample:  1089006140 ( 45.00%) instrs.   17.50 sec.  1.75 GB ram.
sample:  1113206282 ( 46.00%) instrs.   17.80 sec.  1.75 GB ram.
sample:  1137406418 ( 47.00%) instrs.   18.23 sec.  1.75 GB ram.
sample:  1161606552 ( 48.00%) instrs.   18.65 sec.  1.76 GB ram.
sample:  1185806690 ( 49.00%) instrs.   19.06 sec.  1.76 GB ram.
sample:  1210006826 ( 50.00%) instrs.   19.39 sec.  1.76 GB ram.
sample:  1234206960 ( 51.00%) instrs.   19.58 sec.  1.76 GB ram.
sample:  1258407119 ( 52.00%) instrs.   19.75 sec.  1.76 GB ram.
sample:  1282607232 ( 53.00%) instrs.   19.90 sec.  1.76 GB ram.
sample:  1306807373 ( 54.00%) instrs.   20.16 sec.  1.76 GB ram.
sample:  1331007508 ( 55.00%) instrs.   20.37 sec.  1.76 GB ram.
sample:  1355207641 ( 56.00%) instrs.   20.61 sec.  1.76 GB ram.
sample:  1379407783 ( 57.00%) instrs.   20.84 sec.  1.76 GB ram.
sample:  1403607935 ( 58.00%) instrs.   21.03 sec.  1.76 GB ram.
sample:  1427808058 ( 59.00%) instrs.   21.28 sec.  1.76 GB ram.
sample:  1452008195 ( 60.00%) instrs.   21.42 sec.  1.76 GB ram.
sample:  1476208331 ( 61.00%) instrs.   21.73 sec.  1.76 GB ram.
sample:  1500408467 ( 62.00%) instrs.   21.97 sec.  1.76 GB ram.
sample:  1524608600 ( 63.00%) instrs.   22.24 sec.  1.76 GB ram.
sample:  1548808755 ( 64.00%) instrs.   22.49 sec.  1.77 GB ram.
sample:  1573008870 ( 65.00%) instrs.   22.75 sec.  1.77 GB ram.
sample:  1597209007 ( 66.00%) instrs.   23.01 sec.  1.77 GB ram.
sample:  1621409143 ( 67.00%) instrs.   23.26 sec.  1.77 GB ram.
sample:  1645609281 ( 68.00%) instrs.   23.54 sec.  1.77 GB ram.
sample:  1669809415 ( 69.00%) instrs.   23.81 sec.  1.77 GB ram.
sample:  1694009557 ( 70.00%) instrs.   24.12 sec.  1.77 GB ram.
sample:  1718209694 ( 71.00%) instrs.   24.38 sec.  1.77 GB ram.
sample:  1742409825 ( 72.00%) instrs.   24.66 sec.  1.77 GB ram.
sample:  1766609962 ( 73.00%) instrs.   24.90 sec.  1.77 GB ram.
sample:  1790810100 ( 74.00%) instrs.   25.10 sec.  1.77 GB ram.
sample:  1815010235 ( 75.00%) instrs.   25.31 sec.  1.77 GB ram.
sample:  1839210376 ( 76.00%) instrs.   25.53 sec.  1.77 GB ram.
sample:  1863410512 ( 77.00%) instrs.   25.73 sec.  1.77 GB ram.
sample:  1887610645 ( 78.00%) instrs.   25.97 sec.  1.77 GB ram.
sample:  1911810792 ( 79.00%) instrs.   26.18 sec.  1.77 GB ram.
sample:  1936010916 ( 80.00%) instrs.   26.50 sec.  1.78 GB ram.
sample:  1960211054 ( 81.00%) instrs.   26.75 sec.  1.78 GB ram.
sample:  1984411191 ( 82.00%) instrs.   27.04 sec.  1.78 GB ram.
sample:  2008611326 ( 83.00%) instrs.   27.37 sec.  1.78 GB ram.
sample:  2032811464 ( 84.00%) instrs.   27.59 sec.  1.78 GB ram.
sample:  2057011604 ( 85.00%) instrs.   27.83 sec.  1.78 GB ram.
sample:  2081211751 ( 86.00%) instrs.   28.10 sec.  1.78 GB ram.
sample:  2105411880 ( 87.00%) instrs.   28.48 sec.  1.78 GB ram.
sample:  2129612008 ( 88.00%) instrs.   28.72 sec.  1.79 GB ram.
sample:  2153812144 ( 89.00%) instrs.   29.03 sec.  1.79 GB ram.
sample:  2178012287 ( 90.00%) instrs.   29.23 sec.  1.79 GB ram.
sample:  2202212431 ( 91.00%) instrs.   29.52 sec.  1.79 GB ram.
sample:  2226412555 ( 92.00%) instrs.   29.71 sec.  1.79 GB ram.
sample:  2250612689 ( 93.00%) instrs.   29.91 sec.  1.79 GB ram.
sample:  2274812829 ( 94.00%) instrs.   30.09 sec.  1.79 GB ram.
sample:  2299012962 ( 95.00%) instrs.   30.30 sec.  1.79 GB ram.
sample:  2323213104 ( 96.00%) instrs.   30.48 sec.  1.79 GB ram.
sample:  2347413235 ( 97.00%) instrs.   30.67 sec.  1.79 GB ram.
sample:  2371613380 ( 98.00%) instrs.   30.86 sec.  1.79 GB ram.
sample:  2395813517 ( 99.00%) instrs.   31.04 sec.  1.79 GB ram.
./sample-rr-nondet.log:  log is empty.
./sample-rr-nondet.log:  log is empty.
Replay completed successfully. 1
Time taken was: 32 seconds.
Stats:
RR_INPUT_1 number = 0, size = 0 bytes
RR_INPUT_2 number = 0, size = 0 bytes
RR_INPUT_4 number = 7256, size = 101584 bytes
RR_INPUT_8 number = 33198, size = 597564 bytes
RR_INTERRUPT_REQUEST number = 6113, size = 85582 bytes
RR_EXIT_REQUEST number = 0, size = 0 bytes
RR_SKIPPED_CALL number = 570, size = 1204398 bytes
RR_END_OF_LOG number = 1, size = 10 bytes
RR_PENDING_INTERRUPTS number = 0, size = 0 bytes
RR_EXCEPTION number = 0, size = 0 bytes
max_queue_len = 133
Checksum of guest memory: 0x13bbbcdb
Replay completed successfully 2.

$
Stripping down Windows for fast analysis
Emulation is a time-consuming process and it's preferable to improve speed in places that are obvious. A particular strategy that can speed up emulation is to configure the guest system to be in the most performance-focused state. We can do this with Windows systems by limiting the number of visual effects with the following steps:
- 1) Click home button
- 2) Right click on computer
- 3) Select properties
- 4) Navigate to Performance Information and Tools
- 5) Select "Adjust visual effects"
- 6) Select the option "Adjust for best performance" and click apply
At this point you will observe the graphical interface of Windows changing to something more primitive looking, quite similar to the Windows-2000 interface.
Infrastructure to analyse specific samples
At this point we can record an execution and replay it using PANDA, however, we still need a mechanism that allows us to record an execution in which our target application runs. The goal is to have a flexible approach that allows us to transfer our application from our host environment and into the guest environment, and then launch execution of the application inside the guest environment. Furthermore, we want to do this without deploying any scripts or similar inside the guest system.
The structure we will set up is to transfer the target application to the virtual machine through the virtual cd-rom in QEMU, and then execute commands in our virtual machine by sending relevant keystrokes to the virtual machine. This is inspired by the malrec framework from Brendan Dolan-Gavitt here.
Setting up an appropriate snapshot
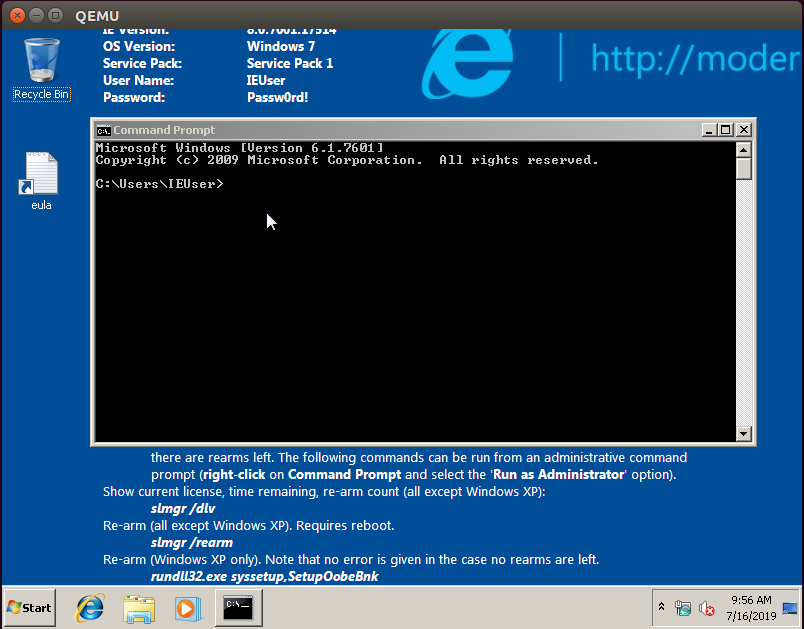
We now have to set up the virtual machine to a state where we can easily execute our application from outside the box. The way we do this is to open a command prompt in our guest system and then save the state of the virtual machine. We are then going to leverage this snapshot by interfacing with the command prompt from outside the box by sending appropriate keystrokes.
In order to create the snapshot, start the virtual machine in PANDA and launch the Windows command line interface inside the guest environment, achieving a state as shown in the following figure.
At this point, type in "savevm" in the QEMU command line interface to save the state of the virtual machine:
		$ ./panda/build/i386-softmmu/qemu-system-i386 -monitor stdio -show-cursor -m 8192 ./IE8_win7_disk1.qcow2
		QEMU 2.9.1 monitor - type 'help' for more information
		(qemu) savevm
This creates a snapshot that we can launch instantly and because the command prompt is in focus inside the guest we can control the guest machine from the outside by sending keystrokes to the machine. In order to launch the snapshot we use the -loadvm flag as shown in the following command:
$ ./panda/build/i386-softmmu/qemu-system-i386 -monitor stdio -show-cursor -m 8192 ./IE8_win7_disk1.qcow2 -loadvm 1
Architecturing the surrounding infrastructure
Recording a sample's execution
We have now set up an appropriate snapshot for our Windows virtual machine and the remaining step is to create the structure that sends the application into the VM and launches the application inside the VM. The strategy we take is to convert the sample to an .iso file, mount this .iso file in our virtual machine and then instruct the virtual machine from outside the box to grab the file in its cd-rom and launch it as an application. In particular, we will send keystrokes to the guest machine that will trigger the following commands in the Command Prompt:
 copy D:\\sample C:\\Users\\IEUser\\Desktop\\sample.exe
 start C:\\Users\\IEUser\\Desktop\\sample.exe
The following Python script automates this process:
We can use this script in the following way, where the -sample argument gives the path on the host system to the sample that will be executed during the recording.
$ python vm_record.py -sample ./sample_app/msg_app.exe
[+] Recording execution msg_app.exe
[+] Recording for 25 seconds
Warning: Creating ISO-9660:1999 (version 2) filesystem.
Warning: ISO-9660 filenames longer than 31 may cause buffer overflows in the OS.
Total translation table size: 0
Total rockridge attributes bytes: 247
Total directory bytes: 0
Path table size(bytes): 10
Max brk space used 0
191 extents written (0 MB)
[+] Made an iso file for the sample
[+] VM started
[+] Started recording and executed the sample in the guest machine
[+] Recording for: 20 seconds
[+] Recording is over, shutting the VM down
[+] VM is shut down
[+] Finished recording the sample execution
Replaying a recording
In it's most simple terms, replaying is much simpler than recording because we only need to replay a recording without interacting with our guest machine. Naturally, as we progress in our use of PANDA and start using plugins, the replaying process itself will become more complex and substantial as we have to interact with the plugins in an appropriate manner. However, for now, we maintain the replaying script as a simple wrapper around calling PANDA.
We can use this script in the following way, where -recording specifies the name of the recording that we want to replay.
$ python vm_replay.py -recording sample
[+] Replaying sample
[+] Launching replay /home/davkor/code/panda/build/i386-softmmu/qemu-system-i386 -monitor stdio -show-cursor -m 8192 -replay sample
[+] Replay launched
[+] Replaying finished
[+] Analysis process finished, exiting
Leveraging existing relevant PANDA plugins
At this point we have created a framework that allows us to easily record and replay an application in PANDA. However, we have yet to do something exciting with the recording that allows us to reverse engineer and study our given application, and this is our next step. To keep this blog post self-contained we will focus on how to use existing PANDA plugins rather than writing our own plugins.
Monitoring the processes of our system
The first step we take is to use two of PANDA's virtual machine introspection (VMI) plugins, osi and win7x86intro, to monitor the processes that execute on the recorded system. Virtual machine introspection is a technique that allows us to interpret the state of the guest system purely based on interpretation of the guest hardware. We need to do this because we do all of our analysis outside the system that we monitor. The added benefit of this is that the guest system remains relatively transparent in comparison to placing analysis-specific artifacts in the guest system, such as an analysis driver. The drawback is that we have to infer OS-level abstractions purely from observing the memory, and we cannot use the normal Windows-provided APIs to do this.
The approach we take is to extend our vm_replay.py script to support initiating the plugins when we replay the execution. The reason we do this is that PANDA's commandlines can quickly become very long and tedious to work with, so we prefer to control the usage of plugins in a more programmatic fashion.
"-panda osi -os windows-32-7 -panda win7x86intro -panda osi_test"
We extend the vm_replay.py plugin with the following code to control it programmatically
We can use this script in the following way
$ python vm_replay.py -recording sample
[+] Replaying sample
[+] Launching replay /home/davkor/code/panda/build/i386-softmmu/qemu-system-i386 -replay sample -monitor stdio -show-cursor -m 8192 -panda osi -os windows-32-7 -panda win7x86intro -panda osi_test
[+] Replay launched
[+] Replaying finished
[+] Analysis process finished, exiting
$ cat ./replay_panda.stdout
QEMU 2.9.1 monitor - type 'help' for more information
(qemu) OSI grabbing Windows introspection backend.
loading snapshot
... done.
opening nondet log for read :   ./sample-rr-nondet.log
Current process: drvinst.exe PID:1592 PPID:556

Process list (46 procs):
  System                4       0
  smss.exe              224     4
  csrss.exe             296     288
  wininit.exe           332     288
  csrss.exe             344     324
  services.exe          400     332
  lsass.exe             416     332
  lsm.exe               424     332
  winlogon.exe          432     324
  svchost.exe           556     400
  svchost.exe           632     400
  svchost.exe           680     400
  svchost.exe           800     400
  svchost.exe           844     400
  svchost.exe           932     400
  userinit.exe          1076    432
  explorer.exe          1084    1076
  dwm.exe               1140    800
  svchost.exe           1196    400
  BGINFO.EXE            1284    1084
  spoolsv.exe           1376    400
  taskhost.exe          1412    400
  svchost.exe           1468    400
  cmd.exe               1552    1084
  conhost.exe           1560    344
  vmicsvc.exe           1660    400
  vmicsvc.exe           1692    400
  vmicsvc.exe           1740    400
  vmicsvc.exe           1776    400
  vmicsvc.exe           1804    400
  svchost.exe           1832    400
  cygrunsrv.exe         1976    400
  wlms.exe              2028    400
  cygrunsrv.exe         880     1976
  conhost.exe           1020    296
  sshd.exe              1136    880
  sppsvc.exe            1052    400
  sppsvc.exe            1052    400
  drvinst.exe           1280    556
  drvinst.exe           756     556
  drvinst.exe           1536    556
  SearchIndexer.        1512    400
  drvinst.exe           1592    556
  svchost.exe           1932    400
  dllhost.exe           2104    556
  rundll32.exe          2112    556
  dinotify.exe          2128    1296

-------------------------------------------------

Dynamic libraries list (24 libs):
        0x00a50000      266240  DrvInst.exe              C:\Windows\system32\DrvInst.exe
        0x77800000      1314816 ntdll.dll                C:\Windows\SYSTEM32\ntdll.dll
        0x75c40000      868352  kernel32.dll             C:\Windows\system32\kernel32.dll
        0x75bc0000      307200  KERNELBASE.dll           C:\Windows\system32\KERNELBASE.dll
        0x76180000      704512  msvcrt.dll               C:\Windows\system32\msvcrt.dll
        0x77460000      1691648 SETUPAPI.dll             C:\Windows\system32\SETUPAPI.dll
        0x75c10000      159744  CFGMGR32.dll             C:\Windows\system32\CFGMGR32.dll
        0x75f60000      663552  RPCRT4.dll               C:\Windows\system32\RPCRT4.dll
        0x75d70000      659456  ADVAPI32.dll             C:\Windows\system32\ADVAPI32.dll
        0x77950000      102400  sechost.dll              C:\Windows\SYSTEM32\sechost.dll
        0x777b0000      319488  GDI32.dll                C:\Windows\system32\GDI32.dll
        0x76640000      823296  USER32.dll               C:\Windows\system32\USER32.dll
        0x77a20000      40960   LPK.dll                  C:\Windows\system32\LPK.dll
        0x76440000      643072  USP10.dll                C:\Windows\system32\USP10.dll
        0x77680000      585728  OLEAUT32.dll             C:\Windows\system32\OLEAUT32.dll
        0x76010000      1425408 ole32.dll                C:\Windows\system32\ole32.dll
        0x75980000      73728   DEVOBJ.dll               C:\Windows\system32\DEVOBJ.dll
        0x750f0000      57344   devrtl.DLL               C:\Windows\system32\devrtl.DLL
        0x77a30000      126976  IMM32.DLL                C:\Windows\system32\IMM32.DLL
        0x76570000      835584  MSCTF.dll                C:\Windows\system32\MSCTF.dll
        0x74f70000      86016   SPINF.dll                C:\Windows\system32\SPINF.dll
        0x75a60000      192512  WINTRUST.dll             C:\Windows\system32\WINTRUST.dll
        0x75a90000      1183744 CRYPT32.dll              C:\Windows\system32\CRYPT32.dll
        0x75970000      49152   MSASN1.dll               C:\Windows\system32\MSASN1.dll

Kernel module list (130 modules):
        0x82851000      4235264 ntoskrnl.exe             \SystemRoot\system32\ntoskrnl.exe
        0x8281a000      225280  hal.dll                  \SystemRoot\system32\halmacpi.dll
        0x80bb2000      32768   kdcom.dll                \SystemRoot\system32\kdcom.dll
        0x8b404000      544768  mcupdate.dll             \SystemRoot\system32\mcupdate_GenuineIntel.dll
        0x8b489000      69632   PSHED.dll                \SystemRoot\system32\PSHED.dll
        0x8b49a000      32768   BOOTVID.dll              \SystemRoot\system32\BOOTVID.dll
        0x8b4a2000      270336  CLFS.SYS                 \SystemRoot\system32\CLFS.SYS
        0x8b4e4000      421888  CI.dll                   \SystemRoot\system32\CI.dll
        0x8b54b000      528384  Wdf01000.sys             \SystemRoot\system32\drivers\Wdf01000.sys
        0x8b5cc000      57344   WDFLDR.SYS               \SystemRoot\system32\drivers\WDFLDR.SYS
        0x8b5da000      294912  ACPI.sys                 \SystemRoot\system32\drivers\ACPI.sys
        0x8b622000      36864   WMILIB.SYS               \SystemRoot\system32\drivers\WMILIB.SYS
        0x8b62b000      32768   msisadrv.sys             \SystemRoot\system32\drivers\msisadrv.sys
        0x8b633000      172032  pci.sys                  \SystemRoot\system32\drivers\pci.sys
        0x8b65d000      45056   vdrvroot.sys             \SystemRoot\system32\drivers\vdrvroot.sys
        0x8b668000      69632   partmgr.sys              \SystemRoot\System32\drivers\partmgr.sys

....
....
....

-------------------------------------------------

Current process: sample.exe PID:2312 PPID:1552

Process list (47 procs):
  System          	4	0
  smss.exe        	224	4
  csrss.exe       	296	288
  wininit.exe     	332	288
  csrss.exe       	344	324
  services.exe    	400	332
  lsass.exe       	416	332
  lsm.exe         	424	332
  winlogon.exe    	432	324
  svchost.exe     	556	400
  svchost.exe     	632	400
  svchost.exe     	680	400
  svchost.exe     	800	400
  svchost.exe     	844	400
  svchost.exe     	932	400
  userinit.exe    	1076	432
  explorer.exe    	1084	1076
  dwm.exe         	1140	800
  svchost.exe     	1196	400
  BGINFO.EXE      	1284	1084
  spoolsv.exe     	1376	400
  taskhost.exe    	1412	400
  svchost.exe     	1468	400
  cmd.exe         	1552	1084
  conhost.exe     	1560	344
  vmicsvc.exe     	1660	400
  vmicsvc.exe     	1692	400
  vmicsvc.exe     	1740	400
  vmicsvc.exe     	1776	400
  vmicsvc.exe     	1804	400
  svchost.exe     	1832	400
  cygrunsrv.exe   	1976	400
  wlms.exe        	2028	400
  cygrunsrv.exe   	880	1976
  conhost.exe     	1020	296
  sshd.exe        	1136	880
  sppsvc.exe      	1052	400
  drvinst.exe     	1280	556
  drvinst.exe     	756	556
  drvinst.exe     	1536	556
  SearchIndexer.  	1512	400
  drvinst.exe     	1592	556
  svchost.exe     	1932	400
  dllhost.exe     	2104	556
  rundll32.exe    	2112	556
  dinotify.exe    	2128	1296
  sample.exe      	2312	1552

-------------------------------------------------

No mapped dynamic libraries.

Kernel module list (130 modules):
	0x82851000	4235264	ntoskrnl.exe             \SystemRoot\system32\ntoskrnl.exe
	0x8281a000	225280	hal.dll                  \SystemRoot\system32\halmacpi.dll
	0x80bb2000	32768	kdcom.dll                \SystemRoot\system32\kdcom.dll
	0x8b404000	544768	mcupdate.dll             \SystemRoot\system32\mcupdate_GenuineIntel.dll
	0x8b489000	69632	PSHED.dll                \SystemRoot\system32\PSHED.dll
	0x8b49a000	32768	BOOTVID.dll              \SystemRoot\system32\BOOTVID.dll
	0x8b4a2000	270336	CLFS.SYS                 \SystemRoot\system32\CLFS.SYS
	0x8b4e4000	421888	CI.dll                   \SystemRoot\system32\CI.dll
	0x8b54b000	528384	Wdf01000.sys             \SystemRoot\system32\drivers\Wdf01000.sys
	0x8b5cc000	57344	WDFLDR.SYS               \SystemRoot\system32\drivers\WDFLDR.SYS
	0x8b5da000	294912	ACPI.sys                 \SystemRoot\system32\drivers\ACPI.sys
	0x8b622000	36864	WMILIB.SYS               \SystemRoot\system32\drivers\WMILIB.SYS
	0x8b62b000	32768	msisadrv.sys             \SystemRoot\system32\drivers\msisadrv.sys
	0x8b633000	172032	pci.sys                  \SystemRoot\system32\drivers\pci.sys

...
...
...
Note that the output in ./replay_panda.stdout becomes quite huge as the state of the system is printed every time a context switch occurs. In particular, the size of my output file was 236MB. Furthermore, we can see in the output all of the processes executing on the system, the DLLs loaded by the currently executing process and also the kernel modules. From the cut-out output we show that PANDA correctly observes the execution of our process, sample.exe, which confirms to us that our process did in fact get executed inside the system.
It's important to emphasize what technically occurred here. We recorded the execution of a full Windows OS executing a sample of our choice and extracted all of the processes on the system as well as information about the dynamically loaded modules. We did this without deploying any code in the OS that executed our sample, meaning that all of the information was derived by interpreting the state of the guest system based on it's hardware. Furthermore, we set up several scripts that enable us to easily do this, which will be very useful for future developments and working with PANDA in general. All of this was achieved with little code as a result of the great ease of using PANDA. This only scratches the surface of the powers of PANDA and PANDA really excels at doing sophisticated analyses rather than just showing the processes on the system. However, we will stop the blog post here as it marks an important first step to using PANDA.
Conclusions
In this blog post we have covered how to set up an analysis environment with PANDA that allows us to do comfortable analysis of a system that runs a given application of our choice. Throughout this small journey we have covered upon several topics, namely (0) an introductory overview of PANDA, (1) enabling Windows-based analysis with PANDA, (2) creating a suitable recording-and-replay infrastructure around PANDA and, finally, (3) an example of how to leverage an existing PANDA plugin to extract artifacts of the guest system.
The goal throughout was to bridge the gap between starting with an interest in PANDA to having a system up and running that can automatically record and execute an arbitrary application and use PANDA's existing capabilities as analysis primitives. The next steps is to write plugins that automate analysis procedures, and we leave this for future blog posts.